Dashboard Development Services for KPI, BI & NOC Dashboards
We build KPI, analytics, BI and monitoring dashboards that managers actually open: live numbers, an attention list, role-based views and mobile layouts. Start from our working NexoraDashboard or get a fully custom build.
KPI & BI dashboardsHospital, ERP/CRM & NOC packsRole-based accessMobile & dark mode2 to 8 weeks
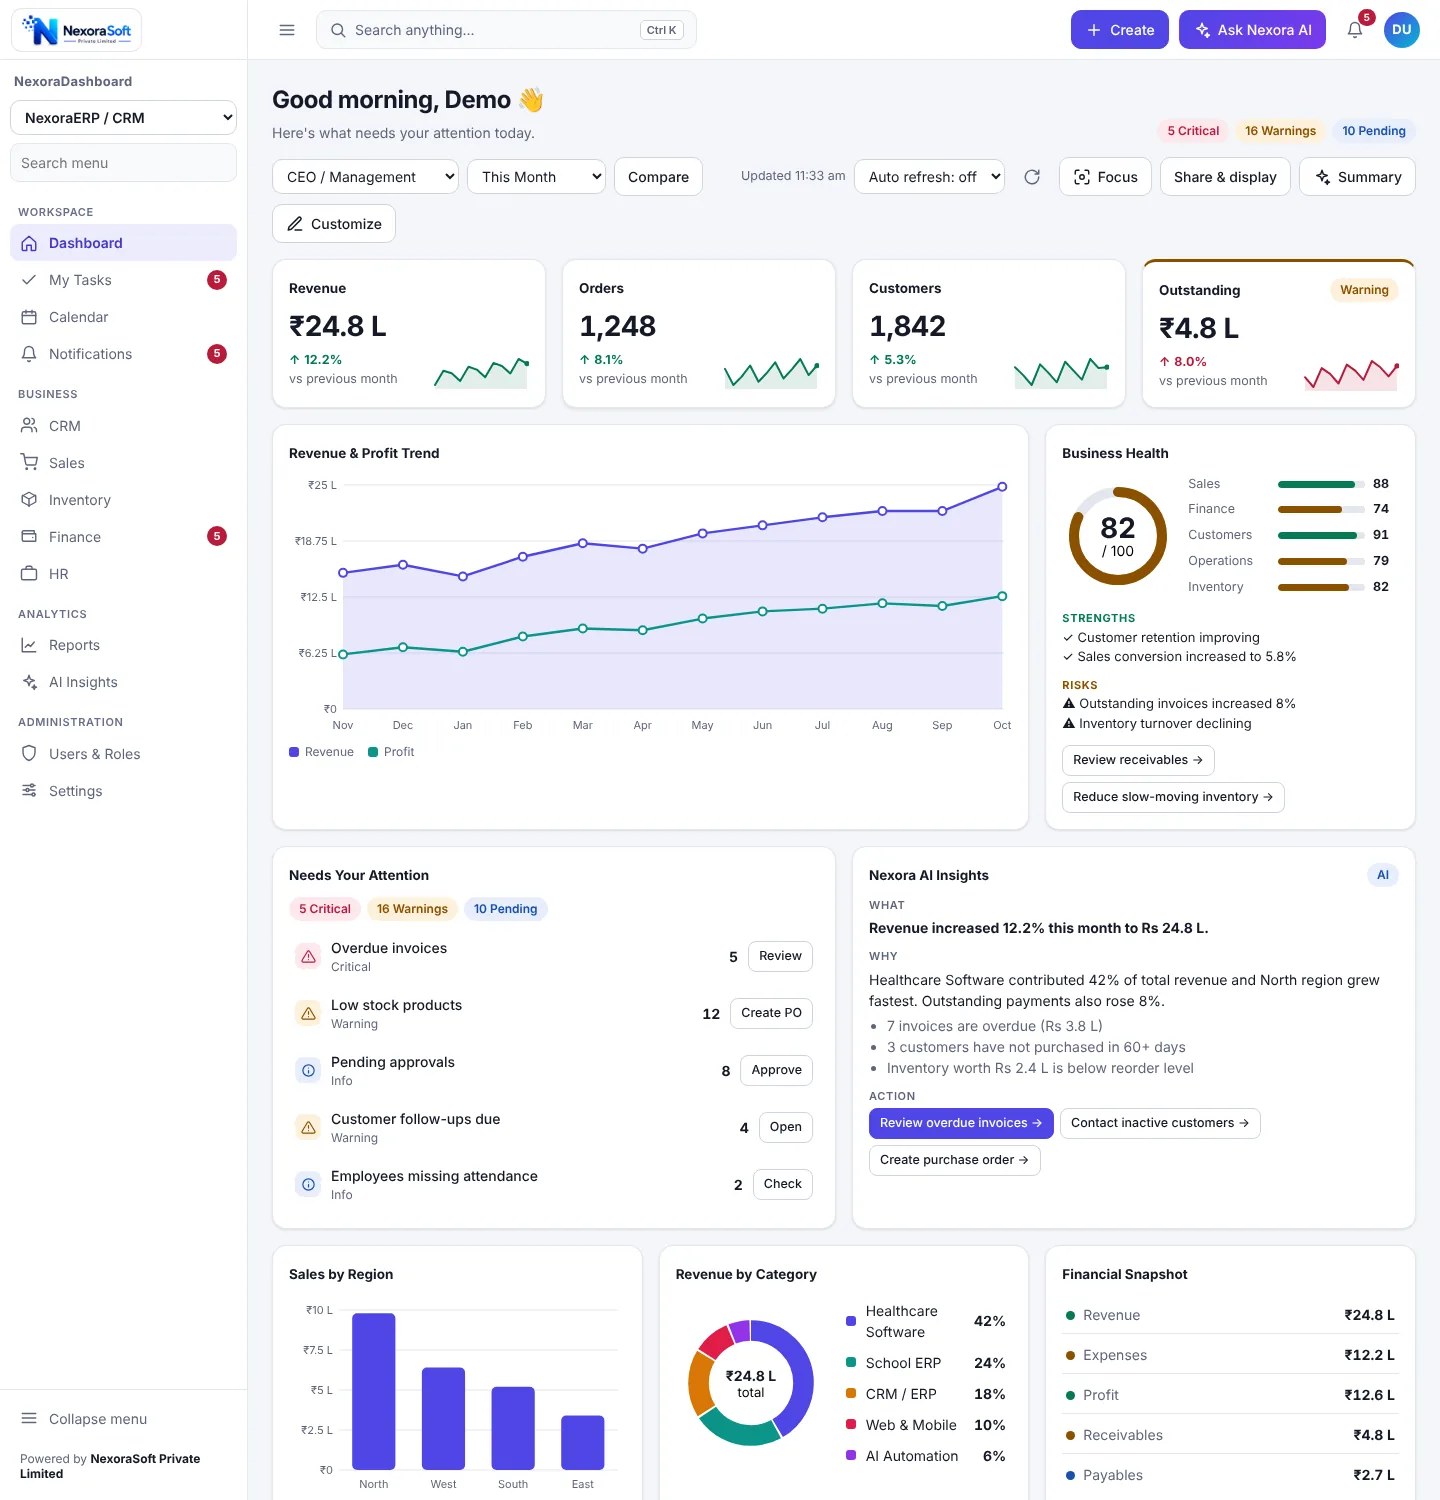
Dashboard Development Services
Real-Time Dashboard
Live operational numbers with auto refresh from 30 seconds to 15 minutes and a wallboard mode for control rooms, sales floors and NOC screens.
KPI Dashboard
The metrics that matter, such as revenue, orders, leads, uptime and bed occupancy, with period comparison, thresholds and drill-down.
Analytics Dashboard
Filters, date ranges, comparisons and drill-through on your transactional database or data warehouse.
BI Dashboard
Data from ERP, CRM and other tools combined into one leadership view with role-based scope.
Monitoring Dashboard
Network, server and storage dashboards for IT and NOC teams, built on SNMP and your monitoring data.
Mobile Dashboards
Responsive layouts with bottom navigation, so managers can check the numbers on a phone.
Start From a Working Dashboard, Not a Blank Page
NexoraDashboard is our own dashboard engine. You see a working dashboard in the demo and then change widgets, roles and data sources to fit you.


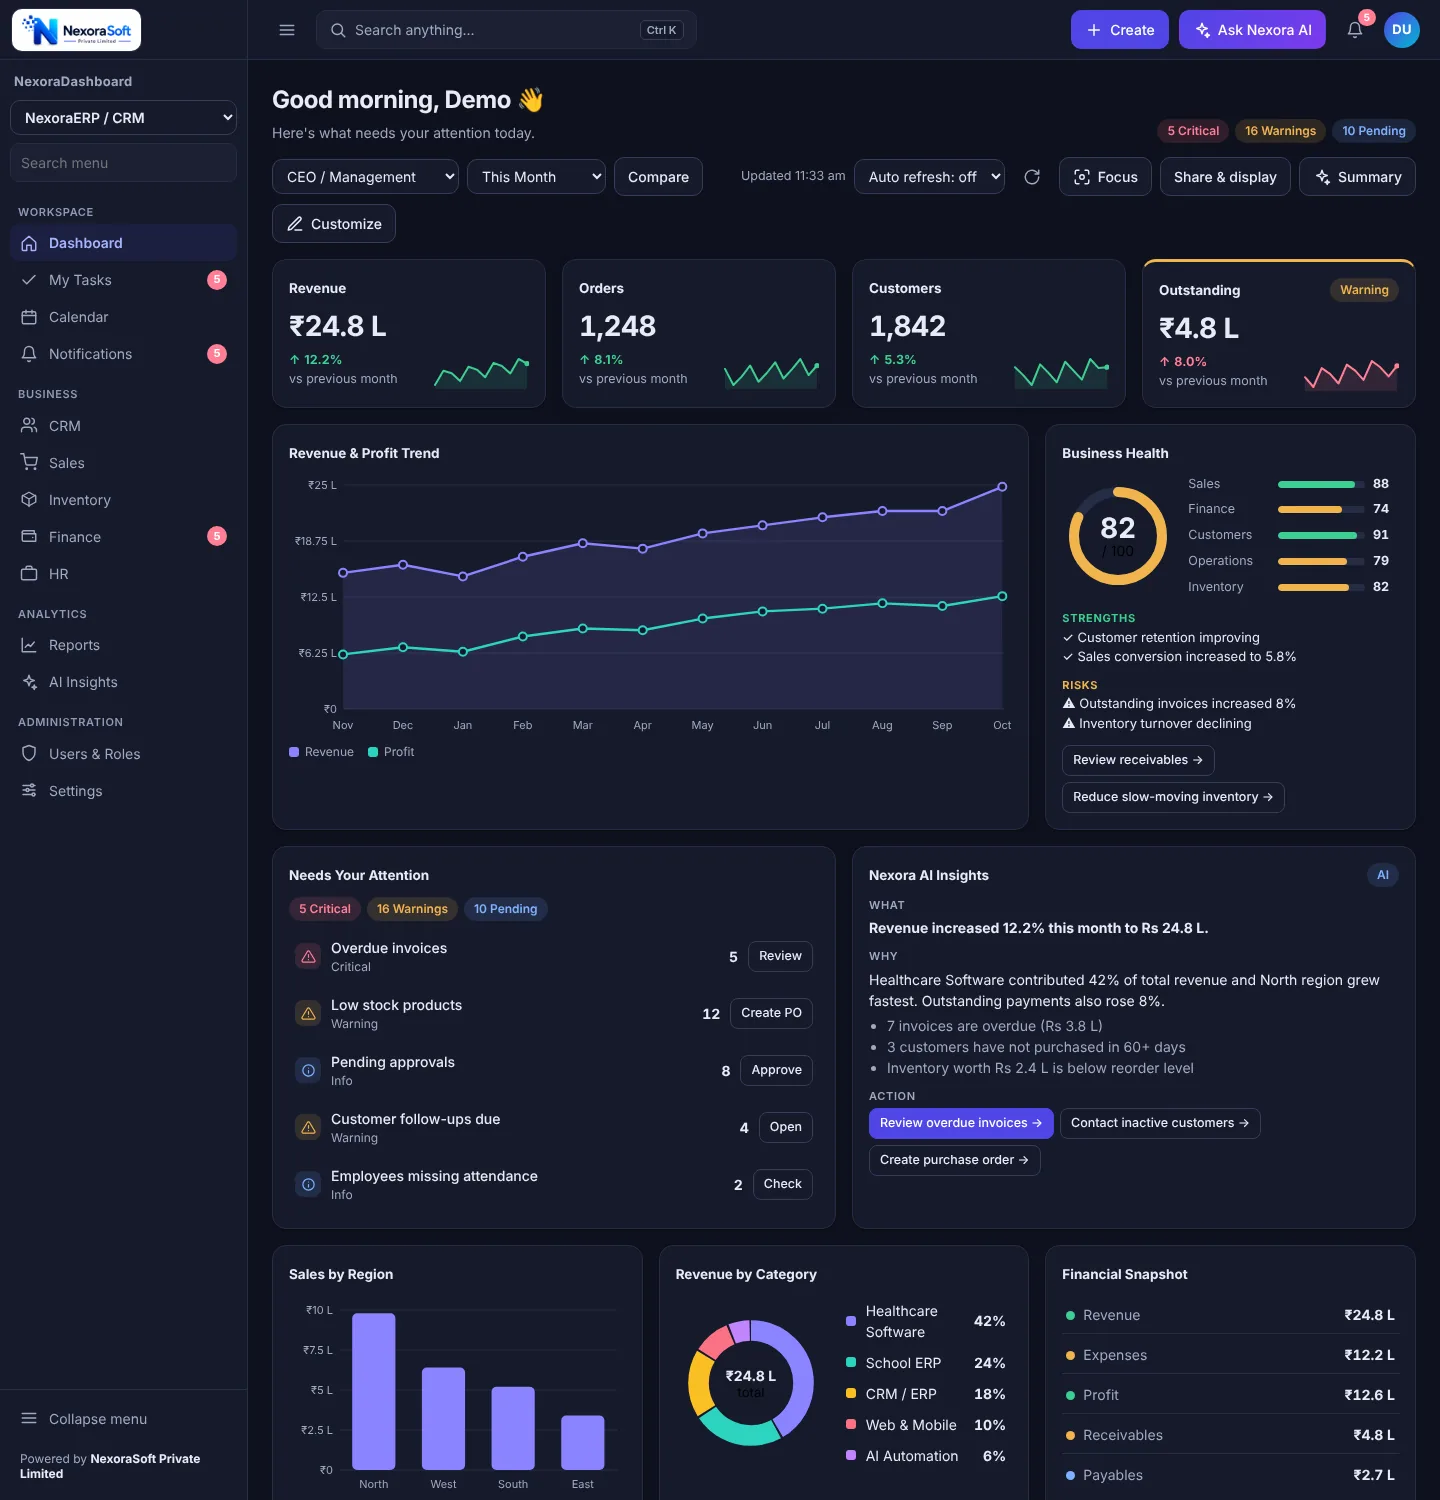
Screenshots are from the working product with sample data. See all NexoraDashboard features.
Dashboard Packs for Your Industry
Hospital dashboard
Footfall, admissions, bed occupancy, department revenue, pending bills and lab load. See hospital dashboard software.
ERP and CRM dashboard
Revenue, profit, orders, funnel, targets, overdue invoices and top performers. See ERP and CRM dashboard software.
NOC dashboard
Node status, critical alarms, bandwidth, CPU, SNMP traps and uptime. See NOC dashboard software. For storage, see the NAS management dashboard.
From KPI List to Live Dashboard in Four Steps
KPI workshop
We list the decisions each role makes and the numbers that support them, ideally eight or fewer per screen.
Data mapping
We find where each number lives, check its quality and agree how fresh it must be.
Build and review
You see a working dashboard early and review it with real data before anything is final.
Launch and train
We install, set roles, train managers and stay available for changes after go-live.
Stack, Data Sources and Delivery
| Topic | Details |
|---|---|
| NexoraDashboard stack | HTML and JavaScript front end, PHP 8 API and MySQL. Runs on ordinary shared hosting or your own server, with no build step and an installer. |
| Custom project stack | Chosen to fit: Chart.js, D3.js, React or Grafana depending on data sources and interactivity. |
| Data sources | MySQL, PostgreSQL, MSSQL, MongoDB, REST APIs, Google Sheets, ERP and CRM systems, SNMP and syslog data. |
| Access control | Role-based permissions enforced by the server, sessions with CSRF protection and login throttling. |
| Delivery | KPI dashboard in 2 to 3 weeks, multi-source BI dashboard in 4 to 8 weeks. Source code is delivered on final payment for custom builds. |
Tell Us the Numbers You Check Every Morning
Share your KPIs and data sources. We will show a working dashboard built around them and give you a quote.
Frequently Asked Questions
Our ready product, NexoraDashboard, uses a plain HTML and JavaScript front end with a PHP 8 API and MySQL, so it runs on ordinary hosting with no build step. For custom projects we choose the stack that fits your data and refresh needs, for example Chart.js, D3.js, React or Grafana.
Yes. We connect to MySQL, PostgreSQL, MSSQL, MongoDB, REST APIs, Google Sheets and most ERP and CRM systems. Each connection is written as a server-side provider, and we handle all the connector work.
A KPI dashboard on one data source usually takes 2 to 3 weeks. A multi-source BI dashboard with drill-downs and role-based views takes 4 to 8 weeks. Starting from NexoraDashboard shortens the first release.
Cost depends on the number of data sources, widgets, roles and integrations. Dashboard and BI projects at NexoraSoft typically start from about ₹60,000 and can go beyond ₹4,00,000 for large multi-source builds. Share your KPIs and sources for an exact quote.
Yes, at the refresh rate that makes sense for each number. NexoraDashboard can auto refresh every 30 seconds, 1, 5 or 15 minutes, and a wallboard mode suits NOC screens. Truly live feeds are scoped per source.
Yes. Role-based access is standard: a CEO sees company-wide KPIs, a finance manager sees finance widgets and a branch manager sees only that branch. Hidden widgets are also refused by the server, not just hidden on screen.
Yes. On phones the layout stacks into cards with bottom navigation, and there are light and dark themes. Dashboards we build are tested on desktop, tablet and mobile.
Power BI suits analysts who build their own reports. A custom dashboard or NexoraDashboard suits operational use: what needs attention today, alerts, tasks, role-based views, and screens for managers who will not open a BI tool.
Yes. We have ready packs for hospital data (OPD, IPD, bed occupancy, billing), ERP and CRM data, and NOC data (nodes, alarms, SNMP traps, bandwidth). See the hospital, ERP and NOC dashboard pages.
For custom builds, source code is delivered on final payment. We can also provide support after go-live. Ready-product licensing is discussed during the demo.